

Backtesting Trading Strategies with Pine Script
Developing a Custom Tool for Simulating Trades and Evaluating Trading Ideas
One of the key features of Pine Script and TradingView is the ability to develop and backtest trading strategies. However, TradingView’s Strategy Engine has certain limitations that can make it difficult to implement or evaluate more complex trading ideas.
When a trading concept goes beyond the structure of a conventional strategy, using a custom indicator to simulate trades can provide a more flexible solution.
For this project, a custom Pine Script system was developed to simulate trade entries, exits, and position management internally rather than relying directly on the strategy order system. The results are then calculated and displayed on the chart in the form of a dedicated statistics table for further analysis.
One of the client’s requirements was the ability to have multiple long and short positions open simultaneously. Since this type of position management cannot be implemented through a conventional Pine Script strategy in the required manner, the entire trading logic was implemented and simulated within a custom indicator.
Note: Due to the proprietary nature of this project, details of the trading logic, entry and exit conditions, and other strategy-specific elements are not disclosed. This page focuses solely on the technical approach and general capabilities of the developed tool.
Why Simulate Trades?
Under normal circumstances, a TradingView strategy operates through the platform’s internal Strategy Engine. This approach works well for many conventional trading strategies, but its limitations can become apparent when dealing with more specialized trading structures.
For example, a conventional strategy does not provide the same independent hedge-style management of long and short positions that may be required in some trading systems. In addition, strategy orders are ultimately tied to the symbol and chart context in which the script is running. Working with data from multiple symbols or timeframes can therefore require additional data handling and more complex logic.
Another common requirement in more advanced projects is the ability to evaluate multiple independent trading systems or sets of rules in parallel, rather than testing a single strategy in isolation.
In these situations, instead of relying entirely on the Strategy Engine, trade execution and position management can be simulated directly within an indicator.
This approach provides considerably more flexibility when designing a custom backtesting environment.
Building a Simulated Trading System
For this project, the core trading logic was not implemented as a conventional TradingView strategy.
Instead, a custom Indicator was developed to evaluate market conditions on each bar and internally manage the state of simulated positions according to the defined rules.
This allows the system to create and manage one or multiple simulated positions throughout the historical data and track when those positions are closed.
Rather than having TradingView handle the orders and positions, the entire process is controlled internally by the script.
This architecture makes it possible to implement scenarios that may not be practical or straightforward to reproduce using the standard Strategy Engine.
Simulating Entries and Exits
One of the core components of the project was the complete simulation of the trade lifecycle.
Based on the defined trading logic, the system can:
- Evaluate entry conditions;
- Manage long and short positions independently;
- Record entry time and price;
- Monitor exit conditions;
- Track and manage open positions throughout the backtest;
- Record and calculate closed trades;
- Calculate the profit or loss of each trade;
- Run multiple strategies with different position-sizing or money-management rules simultaneously;
- And provide a comprehensive set of performance statistics.
As a result, what appears on the chart is more than a collection of buy and sell signals. It is a simulated trading system that tracks the state and behavior of trades throughout the historical data.
Managing Multiple Positions Simultaneously
One of the main advantages of this approach is the greater flexibility it provides when defining trade management rules.
With a simulated trading system, position management can be designed independently of the limitations imposed by the standard Strategy Engine.
For example, the system can accommodate scenarios where multiple positions need to be monitored and managed simultaneously.
In more complex projects, several independent trading logics or systems can also be integrated into a single structure, while the output and performance of each one can be managed separately.
This becomes particularly useful when the goal is to evaluate a combination of multiple trading ideas or systems within the same environment.
Working with Multiple Symbols and Timeframes
Another common requirement in trading projects is the ability to use market data from different symbols or timeframes simultaneously.
Pine Script provides access to data from other symbols and timeframes. However, when this data is used within a more complex trading framework—and trade entries are not limited to the symbol or timeframe of the chart—managing entries, exits, and position states requires a more carefully designed architecture.
For this project, the simulation framework was designed to allow the trading logic to access the required market data and process the results within a unified system.
The goal was therefore not simply to generate signals, but to create a controlled environment for evaluating trading behavior throughout historical market data.
Combining Multiple Trading Logics
In some projects, a trading system consists of several independent components.
Each component may have its own logic, conditions, or trading behavior, while their performance needs to be evaluated alongside one another.
In such cases, instead of running several independent strategies, different trading logics can be integrated into a single simulated environment.
Each component can generate its own signals, while a central system handles position management and calculates the resulting performance.
This architecture provides a more flexible foundation for backtesting complex trading ideas.
In this project, independent entries and exits based on major waves and sub-waves were implemented and processed in parallel within the code.
Displaying Results on the Chart
One of the main goals of the project was to present the results in a way that allows the user to evaluate the system directly on the chart.
For this reason, the results generated by the simulation are displayed through a dedicated statistics panel on the chart.
Depending on the project requirements, the panel can include information such as:
- Total number of trades;
- Number of open positions;
- Number of closed trades;
- Number of winning and losing trades;
- Overall profit and loss;
- Trade-by-trade profit and loss;
- Current position status;
- And other performance metrics required for evaluation.
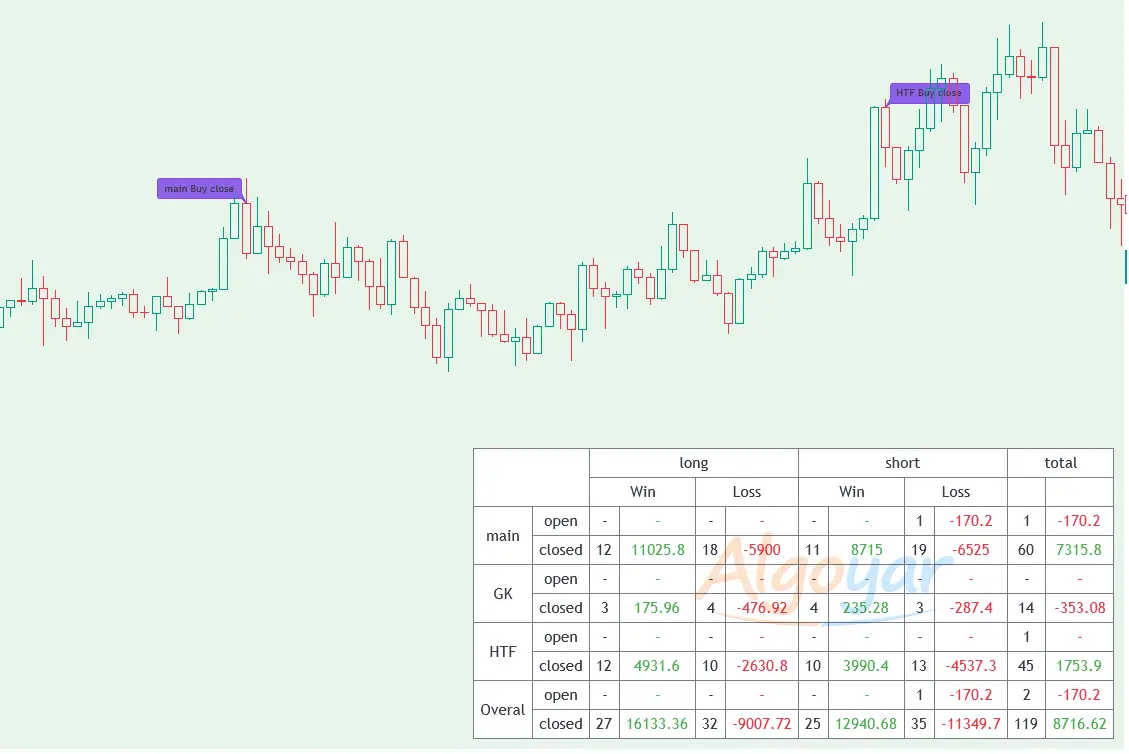
This allows the user to review the overall performance of the system directly on the chart without having to manually extract or analyze the underlying trade data.
Visualizing Trades on the Chart
In addition to the statistics table, simulated trades can also be visualized directly on the chart.
Entry and exit points, trade direction, and other relevant visual information are plotted at their corresponding locations, making it easier to examine the system’s behavior throughout the historical data.
This allows the user not only to see the final results, but also to understand how the system arrived at those results.
In other words, the objective is not simply to answer:
“How profitable was this idea?”
It also provides the ability to examine:
“How did the system actually trade along the way?”
Project Outcome
The final result was a custom tool for simulating and evaluating a trading system in TradingView, allowing trades to be managed and calculated at the script level without being directly constrained by the standard Strategy Engine’s order-management model.
This type of solution can be particularly useful for trading ideas whose structure cannot be easily implemented or backtested using TradingView’s conventional strategy framework.
The most important part of the project was not the visual interface, but the underlying logic for recording, managing, and calculating trades, turning a trading idea into a structured and measurable environment for evaluation.
Additional Project Features
- Sending entry and exit alerts using a standardized format;
- Ability to define a specific backtesting period;
- Ability to enable or disable individual strategies running in parallel within the code;
- Overcoming TradingView’s alert-rate limitation. By default, each indicator can send a maximum of 15 alerts within a 3-minute period.
Protecting Client Confidentiality
This project was developed based on the client’s proprietary trading idea and specific requirements. Since trading ideas, strategies, and entry and exit logic can represent valuable intellectual property, the details of the underlying trading system have not been disclosed in this case study.
The information presented on this page is limited to the technical approach, implementation capabilities, and general architecture of the tool. No information that could reveal or allow the underlying strategy to be reconstructed has been included.
Protecting our clients’ ideas and maintaining confidentiality is an integral part of how we work.